Raman spectroscopy is a technique used to study the vibrational, rotational, and other low-frequency modes of a molecule.
It is based on inelastic scattering of monochromatic light, usually from a laser source.
When a laser beam is shone on a sample, some of the photons from the laser are absorbed by the sample, causing the vibrational modes of the sample’s molecules to change.
When these vibrational modes relax back to their original state, they emit photons with a characteristic frequency that is different from the frequency of the incident laser beam.
These emitted photons, called Raman scattered photons, can be detected and analyzed to provide information about the vibrational modes of the molecules in the sample.
Raman spectroscopy is a powerful tool for studying the structure and properties of a wide variety of materials, including biological samples, polymers, and inorganic compounds.
Raman spectroscopy is a useful technique for the identification of a wide range of substances – solids, liquids, and gases. It is a straightforward, non-destructive technique requiring no sample preparation. Raman spectroscopy involves illuminating a sample with monochromatic light and using a spectrometer to examine light scattered by the sample.
Introduction
Molecular spectra have their origin in transitions between molecular energy levels.
The pattern of such energy levels are a unique characteristics of a molecule.
The magnitude of the Raman effect correlates with polarizability of the electrons in a molecule.
It is a form of inelastic light scattering, where a photon excites the sample.
This excitation puts the molecule into a virtual energy state for a short time before the photon is emitted.
Inelastic scattering means that the energy of the emitted photon is of either lower or higher energy than the incident photon.
After the scattering event, the sample is in a different rotational or vibrational state.
Laser Raman Spectroscopy (LRS)
Raman spectroscopy is a useful technique for the identification of a wide range of substances – solids, liquids, and gases.
It is a straightforward, non-destructive technique requiring no sample preparation.
Raman spectroscopy involves illuminating a sample with monochromatic light and using a spectrometer to examine light scattered by the sample.
At the molecular level photons can interact with matter by absorption or scattering processes.
Scattering may occur either elastically, or inelastically. The elastic process is termed Rayleigh scattering, whilst the inelastic process is termed Raman scattering.
The electric field component of the scattering photon perturbs the electron cloud of the molecule and may be regarded as exciting the system to a ‘virtual’ state.
Raman scattering occurs when the system exchanges energy with the photon, and the system subsequently decays to vibrational energy levels above or below that of the initial state.
The frequency shift corresponding to the energy difference between the incident and scattered photon is termed the Raman shift.
Depending on whether the system has lost or gained vibrational energy, the Raman shift occurs either as an up- or down-shift of the scattered photon frequency relative to that of the incident photon.
The down-shifted and up-shifted components are called respectively the Stokes and anti-Stokes lines.
A plot of detected number of photons versus Raman shift from the incident laser energy gives a Raman spectrum.
Different materials have different vibrational modes, and therefore characteristic Raman spectra.
This makes Raman spectroscopy a useful technique for material identification.
There is one important distinction to make between the Raman spectra of gases and liquids, and those taken from solids – in particular, crystals.
For gases and liquids it is meaningful to speak of the vibrational energy levels of the individual molecules which make up the material.
Crystals do not behave as if composed of molecules with specific vibrational energy levels, instead the crystal lattice undergoes vibration.
These macroscopic vibrational modes are called phonons.
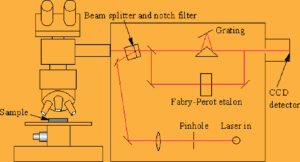
In modern Raman spectrometers, lasers are used as a photon source due to their highly monochromatic nature, and high beam fluxes.
This is necessary as the Raman effect is weak, typically the Stokes lines are ~105 times weaker than the Rayleigh scattered component.
In the visible spectral range, Raman spectrometers use notch filters to cut out the signal from a very narrow range centred on the frequency corresponding to the laser radiation.
Most Raman spectrometers for material characterisation use a microscope to focus the laser beam to a small spot (<1-100mm diameter).
Light from the sample passes back through the microscope optics into the spectrometer.
Raman shifted radiation is detected with a charge-coupled device (CCD) detector, and a computer is used for data acquisition and curve fitting.
These factors have helped Raman spectroscopy to become a very sensitive and accurate technique.
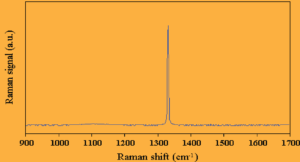
Natural diamond exhibits one main Raman active vibration which manifests itself as a sharp first order peak in the Raman spectrum at ~1332 cm-1 in natural diamond and a weak second order feature at ~2750 cm-1 .
A Raman spectrum taken from a natural diamond sample, showing the first order peak, is presented in the above figure.
The first order peak is well fitted with a Lorentzian line shape, the full-width at half the peak height (FWHM), is typically £2 cm-1.
In diamond films grown by CVD, carbon is also incorporated into the film in non-diamond forms. These non-diamond carbons may be graphitic or amorphous carbon regions in the film.
The Raman spectrum of an infinite crystal of pure graphite (or a large single crystal sample, in practice) would show one sharp peak at 1580 cm-1 .
For small crystallite sizes, the selection rules concerning the Raman inactivity of certain phonons in infinite graphite crystals are relaxed as the crystal can no longer be regarded as infinite.
The sharp graphite peak becomes a broad band (the G-band). and a ‘disordered’ (or D-band) peak appears in the spectrum at ~1350 cm-1.
Amorphous carbon produces a broad asymmetric hump in the region 1000-1600 cm-1.
Both graphite and amorphous carbon have Raman scattering efficiencies greater than that of diamond.
This means that for identical numbers of sampled atoms in the three carbon forms – diamond, graphite, and amorphous carbon, the graphite and amorphous carbon samples would give a much larger Raman signal than the diamond sample.
These scattering efficiency ratios, relative to diamond have been reported to be ~50 times for graphite, and ~233 times for amorphous carbon, both measured using 514.5 nm laser radiation.
Diamond is highly transparent to visible laser radiation, whilst graphitic regions are not.
The penetration thickness, or thickness through which the transmitted laser radiation may pass before its intensity reaches e-1 (~37%) of its incident value, is 50 nm for graphite using 488.0 nm laser radiation.
Hence Raman spectroscopy probes the bulk of transparent, good quality diamond.
In poor quality samples, graphitic inclusions can ‘screen out’ the diamond signal from diamond regions deeper in the sample making the Raman spectrum indicate a worse quality film than is actually the case.
In addition, some features of the diamond Raman spectrum change their intensity and position as the laser excitation wavelength is varied.
Thus, the choice of laser wavelength used is important when obtaining Raman spectra.
Diamond exhibits photoluminescence and this is also detected by the Raman spectrometer, with the Raman spectrum superimposed on it.
It can be seen that the deconvolution and quantitative interpretation of CVD diamond Raman spectra is not a straightforward process.
Raman Shift
Raman shifts are typically reported in wavenumbers, which have units of inverse length, as this value is directly related to energy. In order to convert between spectral wavelength and wavenumbers of shift in the Raman spectrum, the following formula can be used:

where Δν̃ is the Raman shift expressed in wavenumber, λ0 is the excitation wavelength, and λ1 is the Raman spectrum wavelength.
Most commonly, the unit chosen for expressing wavenumber in Raman spectra is inverse centimeters (cm−1).
Since wavelength is often expressed in units of nanometers (nm), the formula above can scale for this unit conversion explicitly, giving:

Applications
Raman spectroscopy is used in chemistry to identify molecules and study chemical bonding and intramolecular bonds.
Because vibrational frequencies are specific to a molecule’s chemical bonds and symmetry (the fingerprint region of organic molecules is in the wavenumber range 500–1,500 cm−1).
Raman provides a fingerprint to identify molecules.
For instance, Raman and IR spectra were used to determine the vibrational frequencies of SiO, Si2O2, and Si3O3 on the basis of normal coordinate analyses.
Raman is also used to study the addition of a substrate to an enzyme.
In solid-state physics, Raman spectroscopy is used to characterize materials, measure temperature, and find the crystallographic orientation of a sample.
As with single molecules, a solid material can be identified by characteristic phonon modes.
Information on the population of a phonon mode is given by the ratio of the Stokes and anti-Stokes intensity of the spontaneous Raman signal.
Raman spectroscopy can also be used to observe other low frequency excitations of a solid, such as plasmons, magnons, and superconducting gap excitations.
Distributed temperature sensing (DTS) uses the Raman-shifted backscatter from laser pulses to determine the temperature along optical fibers.
The orientation of an anisotropic crystal can be found from the polarization of Raman-scattered light with respect to the crystal and the polarization of the laser light, if the crystal structure’s point group is known.
In nanotechnology, a Raman microscope can be used to analyze nanowires to better understand their structures, and the radial breathing mode of carbon nanotubes is commonly used to evaluate their diameter.
Raman active fibers, such as aramid and carbon, have vibrational modes that show a shift in Raman frequency with applied stress. Polypropylene fibers exhibit similar shifts.
In solid state chemistry and the bio-pharmaceutical industry, Raman spectroscopy can be used to not only identify active pharmaceutical ingredients (APIs), but to identify their polymorphic forms, if more than one exist.
For example, the drug Cayston (aztreonam), marketed by Gilead Sciences for cystic fibrosis,can be identified and characterized by IR and Raman spectroscopy.
Using the correct polymorphic form in bio-pharmaceutical formulations is critical, since different forms have different physical properties, like solubility and melting point.
Raman spectroscopy has a wide variety of applications in biology and medicine.
It has helped confirm the existence of low-frequency phonons[20] in proteins and DNA, promoting studies of low-frequency collective motion in proteins and DNA and their biological functions.
Raman reporter molecules with olefin or alkyne moieties are being developed for tissue imaging with SERS-labeled antibodies.
Raman spectroscopy has also been used as a noninvasive technique for real-time, in situ biochemical characterization of wounds.
Multivariate analysis of Raman spectra has enabled development of a quantitative measure for wound healing progress.
Spatially offset Raman spectroscopy (SORS), which is less sensitive to surface layers than conventional Raman, can be used to discover counterfeit drugs without opening their packaging, and to non-invasively study biological tissue.
A huge reason why Raman spectroscopy is so useful in biological applications is because its results often do not face interference from water molecules, due to the fact that they have permanent dipole moments, and as a result, the Raman scattering cannot be picked up on.
This is a large advantage, specifically in biological applications.[30] Raman spectroscopy also has a wide usage for studying biominerals.
Lastly, Raman gas analyzers have many practical applications, including real-time monitoring of anesthetic and respiratory gas mixtures during surgery.
Raman spectroscopy has been used in several research projects as a means to detect explosives from a safe distance using laser beams.
Raman Spectroscopy is being further developed so it could be used in the clinical setting. Raman4Clinic is a European organization that is working on incorporating Raman Spectroscopy techniques in the medical field.
They are currently working on different projects, one of them being monitoring cancer using bodily fluids such as urine and blood samples which are easily accessible.
This technique would be less stressful on the patients than constantly having to take biopsies which are not always risk free.